I start my node but after a short time its stops and i have to restart it. I am running on a Pi 4B with Raspian Buster. I will be checking the status and i notice the node has stopped running. I have it running on a dedicated ip through my router. Sometimes it’s hours other times its less than 30 minutes.
Node stops running
here is some more info I did a force update but its still giving the same results.
pi@postgres:~/node $ ./goal node status -d data -w 1000
Last committed block: 13274294
Time since last block: 8.5s
Sync Time: 162.7s
Last consensus protocol: GitHub - algorandfoundation/specs at 3a83c4c743f8b17adfd73944b4319c25722a6782
Next consensus protocol: GitHub - algorandfoundation/specs at ac2255d586c4474d4ebcf3809acccb59b7ef34ff
Round for next consensus protocol: 13409876
Next consensus protocol supported: true
Last Catchpoint:
Genesis ID: mainnet-v1.0
Genesis hash: wGHE2Pwdvd7S12BL5FaOP20EGYesN73ktiC1qzkkit8=
after a few seconds this happens
Cannot contact Algorand node: Get “http://127.0.0.1:8080/v2/status”: read tcp 127.0.0.1:42996->127.0.0.1:8080: read: connection reset by peer
Can you post the end of the log data/node.log?
Can you check RAM use?
Can you check algod was not killed because of OOM (do dmesg -T | egrep -i 'killed process')?
What command should i use to get the node.log file open so I can copy and paste it for you? I tried opening the file in the text editor but it does not work
Ram Use
total used free shared buff/cache available
Mem: 3827 358 2253 106 1215 3236
Swap: 99 85 14
HDD status
Filesystem Size Used Avail Use% Mounted on
/dev/root 470G 16G 435G 4% /
devtmpfs 1.8G 0 1.8G 0% /dev
tmpfs 1.9G 44M 1.9G 3% /dev/shm
tmpfs 1.9G 8.6M 1.9G 1% /run
tmpfs 5.0M 4.0K 5.0M 1% /run/lock
tmpfs 1.9G 0 1.9G 0% /sys/fs/cgroup
/dev/mmcblk0p1 253M 48M 205M 19% /boot
tmpfs 383M 8.0K 383M 1% /run/user/1000
MemTotal: 3919128 kB
MemFree: 2283892 kB
MemAvailable: 3292340 kB
Buffers: 13560 kB
Cached: 1231556 kB
SwapCached: 5596 kB
Active: 301796 kB
Inactive: 1173588 kB
Active(anon): 91060 kB
Inactive(anon): 263372 kB
Active(file): 210736 kB
Inactive(file): 910216 kB
Unevictable: 74852 kB
Mlocked: 16 kB
HighTotal: 3264512 kB
HighFree: 1706448 kB
LowTotal: 654616 kB
LowFree: 577444 kB
SwapTotal: 102396 kB
SwapFree: 16592 kB
Dirty: 124 kB
Writeback: 0 kB
AnonPages: 299664 kB
Mapped: 233244 kB
Shmem: 124164 kB
KReclaimable: 15452 kB
Slab: 37400 kB
SReclaimable: 15452 kB
SUnreclaim: 21948 kB
KernelStack: 2768 kB
PageTables: 13408 kB
NFS_Unstable: 0 kB
Bounce: 0 kB
WritebackTmp: 0 kB
CommitLimit: 2061960 kB
Committed_AS: 2774364 kB
VmallocTotal: 245760 kB
VmallocUsed: 5376 kB
VmallocChunk: 0 kB
Percpu: 512 kB
CmaTotal: 262144 kB
CmaFree: 243796 kB
Out of memory: Killed process 2076 (mousepad) total-vm:1883304kB, anon-rss:1529396kB, file-rss:14108kB, shmem-rss:4kB, UID:1000 pgtables:3160kB oom_score_adj:0
To show the end of node.log, run tail -n 25 data/node.log.
You can paste the result there between triple backquotes ```…``` to have better formatting.
But it looks like the issue is that you run out of RAM (OOM).
Can you add a bit of swap (https://raspberrypi.stackexchange.com/a/1605)?
E.g., 4GB of swap?
Also are you running many processes beyond Algorand?
{“Context”:“Agreement”,“Hash”:"",“ObjectPeriod”:0,“ObjectRound”:0,“ObjectStep”:0,“Period”:0,“Round”:13252113,“Sender”:"",“Step”:0,“Type”:“RoundInterrupted”,“Weight”:0,“WeightTotal”:0,“file”:“demux.go”,“function”:“github.com/algorand/go-algorand/agreement.(*demux).next”,“level”:“info”,“line”:285,“msg”:“agreement: round 13252113 ended early due to concurrent write; next round is 13252114”,“time”:“2021-04-18T16:01:02.610354-04:00”}
{“callee”:“github.com/algorand/go-algorand/data/account.Participation.DeleteOldKeys.func1.1",“caller”:“github.com/algorand/go-algorand/data/account/participation.go:95”,“file”:“dbutil.go”,“function”:"github.com/algorand/go-algorand/util/db.(*Accessor).atomic”,“level”:“warning”,“line”:344,“msg”:“dbatomic: tx surpassed expected deadline by 1.380898664s”,“readonly”:false,“time”:“2021-04-18T16:01:03.263725-04:00”}
the only thing running on this is my Algo Node and indexer
Can you check that you have the latest version:
$ goal version -v -d data
Version: [v1 v2]
GenesisID: mainnet-v1.0
Build: 2.5.4.stable [rel/stable] (commit #7cd7aef0)
If you have the latest version, my guess is unfortunately that 4GB for archival algod + indexer will be a bit too tight.
Can you try to stop the indexer and see if algod works in that setting?
whats the command to stop the indexer?
Try:
pkill algorand-indexer
and check it is not running anymore using
ps augx | grep indexer
or using top / htop.
i ran both commands and this was the result
pi 3759 0.0 0.0 7348 524 pts/0 S+ 16:40 0:00 grep --color=auto indexer
i restarted node and got the same result after about 1 min it terminates.
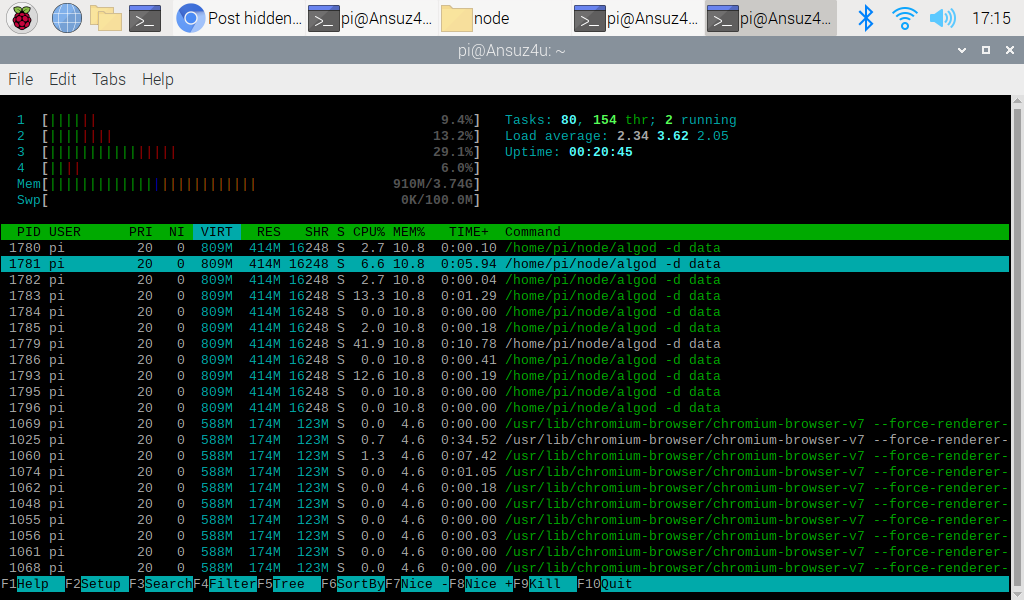
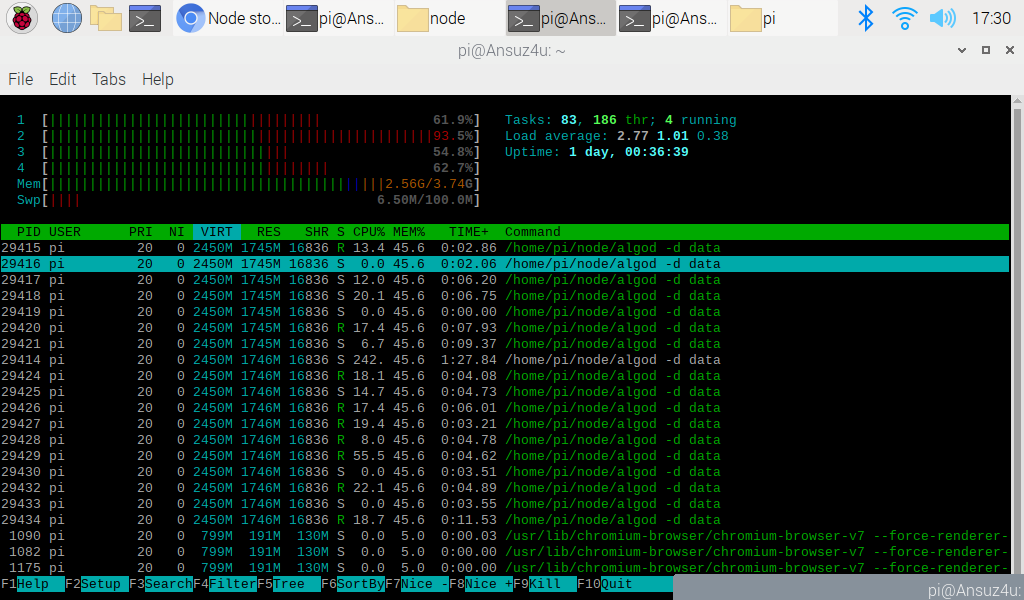
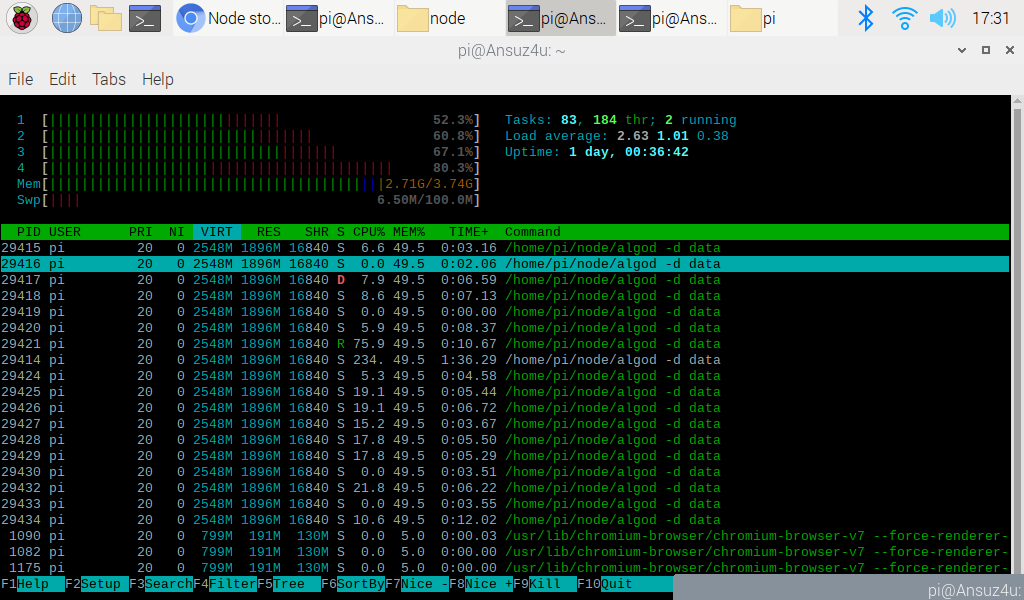
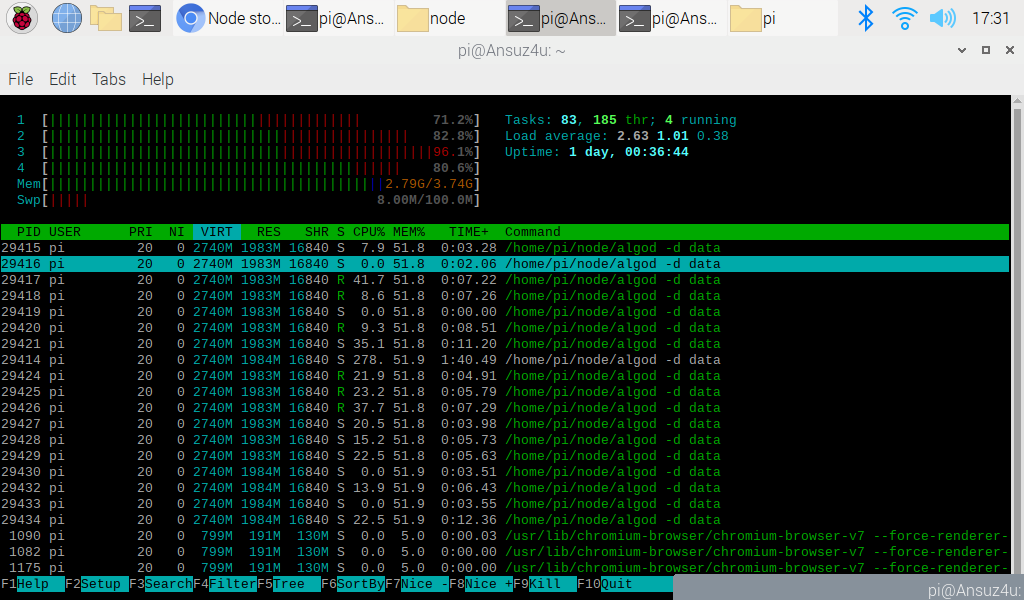
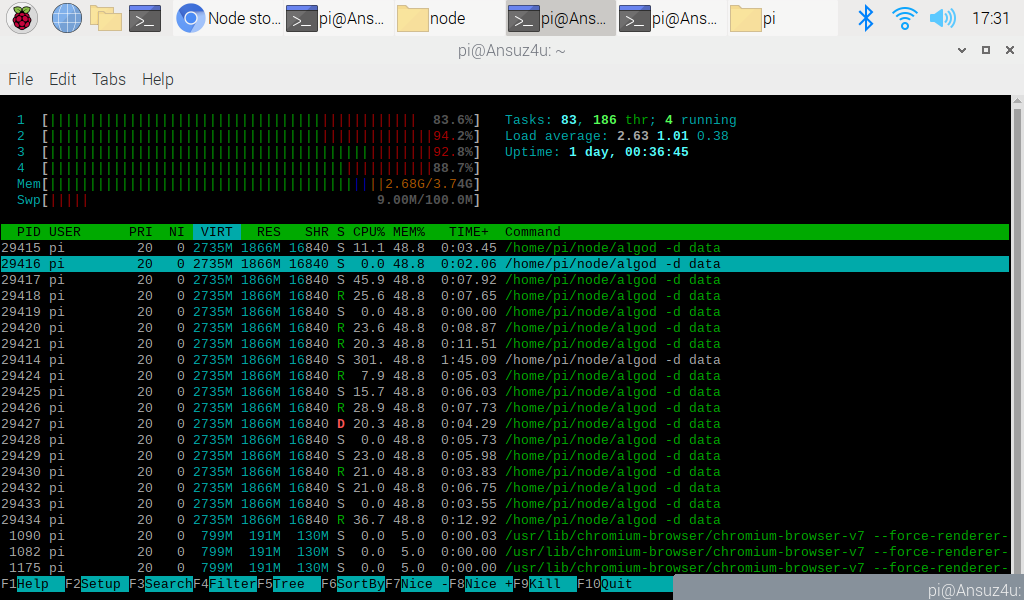
Can you run htop in a different terminal and sort by memory use?
Then start the node, and take a screenshot when memory start being used a lot?
Did you check goal version -v?
Can you also post again goal node start -d data?
Version: [v1 v2]
GenesisID: mainnet-v1.0
Build: 2.5.4.stable [rel/stable] (commit #7cd7aef0)
This seems good. Can you get a screenshot closer to a crash?
I tried to get a spike when all were maxed out but missed it will keep trying till I get one.
I think the issue seems to be that 4GB of RAM is not sufficient.
Can you add 4GB of swap via https://raspberrypi.stackexchange.com/a/1605?
I’m rather new to using the pi just curious if you could help me out with the proper command lines to run. I will try increasing the swap file.
To add swap:
- edit the file
/etc/dphys-swapfileusing root, e.g.,sudo nano /etc/dphys-swapfile - replace the line
CONF_SWAPSIZE=100withCONF_SWAPSIZE=4096 - restart swap:
sudo /etc/init.d/dphys-swapfile restart
Also, disable catchpoint tracking following this post: Archival Node Sync Time - #6 by tsachi
You will need to create a file config.json in your data folder data/ if it does not exist. It’s a JSON file and you must make it look something like:
{
"CatchpointTracking": -1,
...
}
(where ... are all the other settings - if no other settings remove the comma above)
Thank you I will do this when I get home from work.
Edit this is using -w command it never did this before…
pi@Ansuz4u:~/node ./goal node start -d data
Algorand node successfully started!
pi@Ansuz4u:~/node ./goal node status -d data -w 1000
Last committed block: 13262769
Time since last block: 0.0s
Last committed block: 13262773
Time since last block: 1.9s
Last committed block: 13262782
Time since last block: 2.2s
Last committed block: 13262798
Time since last block: 2.0s
Last committed block: 13262818
Time since last block: 2.1s
Last committed block: 13262835
Time since last block: 1.3s
Last committed block: 13262840
Time since last block: 2.7s
Last committed block: 13262840
Time since last block: 3.7s
Last committed block: 13262851
Time since last block: 1.1s
Last committed block: 13262856
Time since last block: 2.7s
Last committed block: 13262872
Time since last block: 2.8s
Last committed block: 13262898
Time since last block: 1.2s
Last committed block: 13262900
Time since last block: 0.8s
Last committed block: 13262900
Time since last block: 3.6s
Last committed block: 13262900
Time since last block: 4.6s
Last committed block: 13262900
Time since last block: 5.6s
Last committed block: 13262916
Time since last block: 1.4s
Last committed block: 13262938
Time since last block: 2.8s
Last committed block: 13262942
Time since last block: 1.3s
Last committed block: 13262963
Time since last block: 3.9s
Sync Time: 60.3s
Last consensus protocol: GitHub - algorandfoundation/specs at 3a83c4c743f8b17adfd73944b4319c25722a6782
Next consensus protocol: GitHub - algorandfoundation/specs at 3a83c4c743f8b17adfd73944b4319c25722a6782
Round for next consensus protocol: 13262964
Next consensus protocol supported: true
Last Catchpoint:
Genesis ID: mainnet-v1.0
Genesis hash: wGHE2Pwdvd7S12BL5FaOP20EGYesN73ktiC1qzkkit8=
Cannot contact Algorand node: Get “http://127.0.0.1:8080/versions”: dial tcp 127.0.0.1:8080: connect: connection reset by peer
pi@Ansuz4u:~/node $
Edit
I did notice that it did not use the swap file at all during the time it was running prior to the node stopping
I also closed out of chromium to see if that was effecting it
I did some digging and found this it seemed promising so I followed it.
still doing the same thing but the memory usage is a lot less. still some spikes to 98% but not like it was and its not touching the swap file.
Thinking back this problem started when i tried to set up the participation node.
So just as an Idea what should my part key string look like following the instructions.
$./goal account addpartkey -a address-of-participating-account --roundFirstValid= partkey-first-round --roundLastValid= partkey-last-round --keyDilution= key-dilution-value
Using numbers for round first valid and round last valid and key dilution? Im think me not adding enough or key dilution or private spending key? is the private spending key my send algo from my algo wallet?
I get this exact same issue:
Get “http://127.0.0.1:8080/v1/transactions/params”: dial tcp 127.0.0.1:8080: connect: connection refused
seems to be happening at random but I got it twice after callig goal account changeonlinestatus…
Welcome to Algorand!
The first step is to check that your node is powerful enough. Now you need at least 8GB of RAM and a not-too-slow SSD. An SD card or an HDD will be too slow.
If you are satisfying the above specs, then can you check RAM use, CPU use just before the crash?
I am running it with a rpi 4gb ram. I increased the swap file to 2gb though. Running it with an m.2 so hd shouldn’t be an issue. It could be a ram problem indeed… I did not check it before the crash.